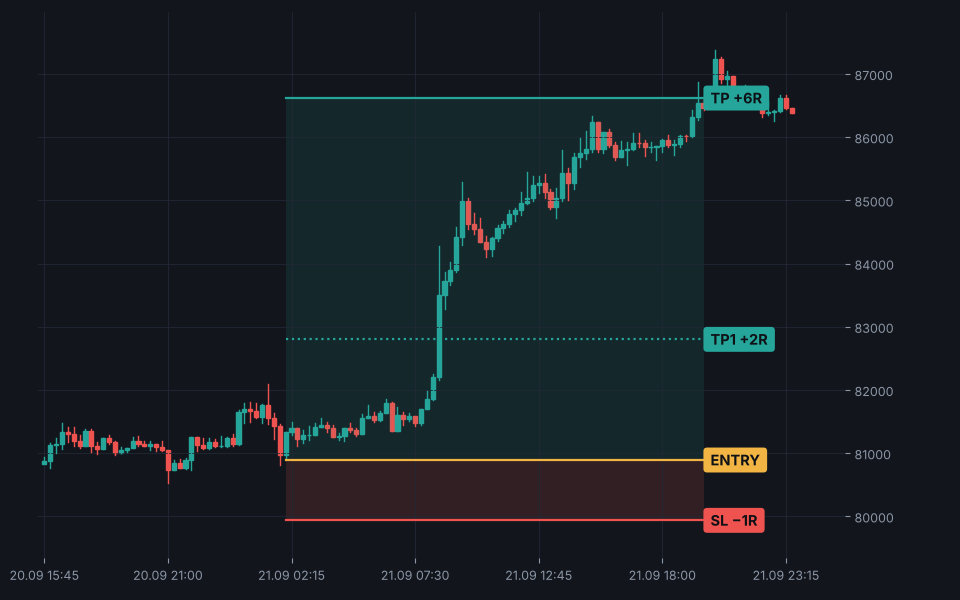
1h chart
Breakout
Range breakout with unusually high volume, in trend direction only. Profits are taken in stages.
Why we built Zero Tilt
Fake screenshots, rented Lambos, promises of easy money. No wonder hardly anyone trusts trading content anymore. We built Zero Tilt to do it differently: a serious tool, built on trust.
Our goal is simple: help people trade with discipline instead of emotions.
The statistics on this page come from a backtest. We show all of it, including every weak month and year, and we label it as what it is.
Since November 1, 2026 we publish every signal live with a timestamp, including every loss. That is the track record that counts. If you join now, you are in the beta and pay the founding price.
The system loses often. In the backtest it wins because winners are bigger than losers, not because it is right most of the time. If you cannot accept that, it is not for you.
How it works
1h chart
Range breakout with unusually high volume, in trend direction only. Profits are taken in stages.
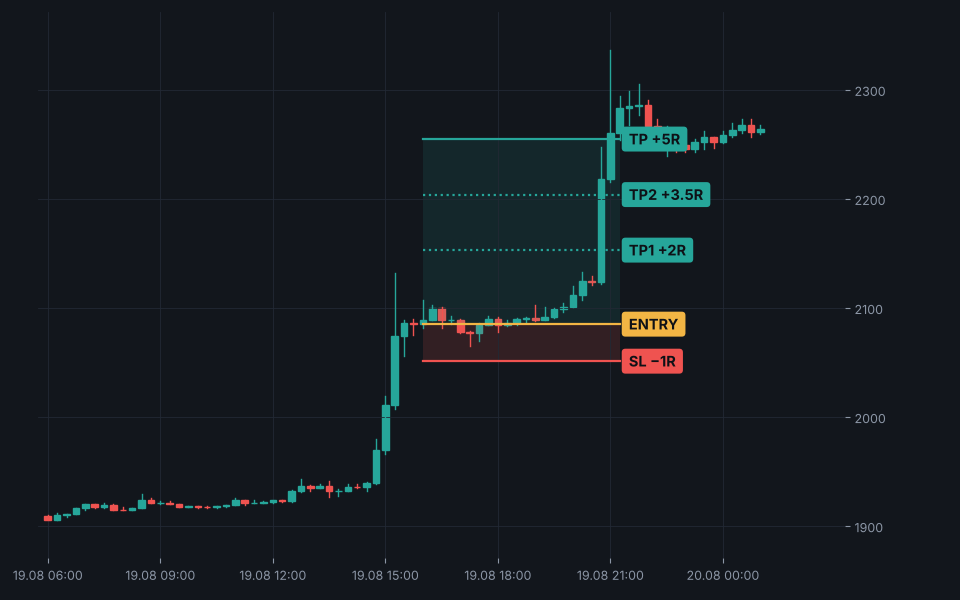
15m chart
Market structure shift in the trend, entry with a limit order on the pullback. The stop is trailed by fixed rules. The limit order stays valid for up to 30 hours, so you have time to place it.
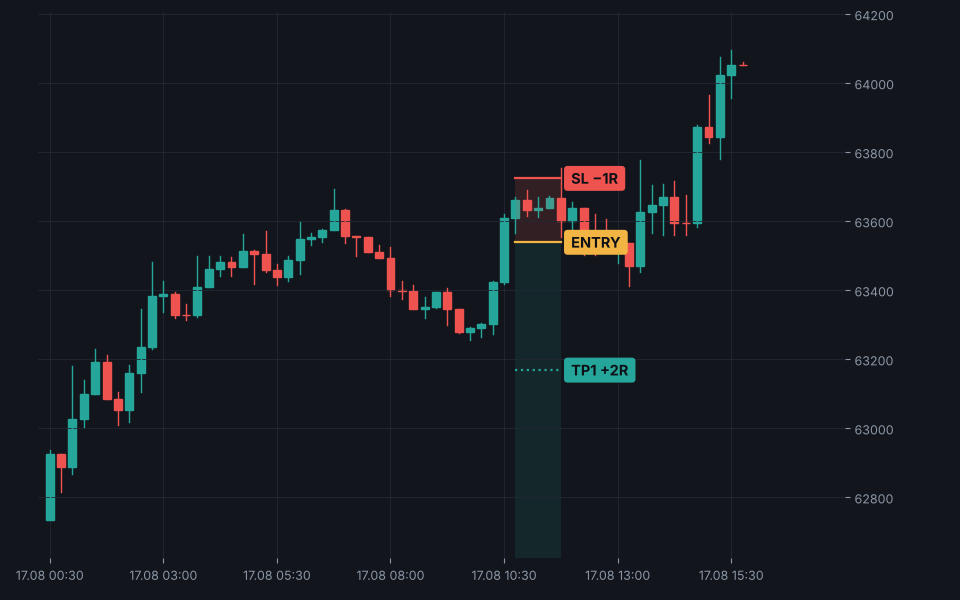
5m chart
Short counter-move after a sudden crash. Rare, but with clearly limited risk and a fixed holding time.
01
Signal appears
The indicator detects a setup on BTC, ETH or XRP and draws entry, stop and target on the chart.
02
Push to your phone
TradingView sends the alert to your phone, even when your computer is off. No screen time needed.
03
You place the trade
Copy entry, stop, target and position size into your exchange. Takes about a minute.
04
Alerts guide the rest
Follow-up alerts tell you when to take partial profits, trail the stop or close. No decisions in the heat of the moment.
Backtest Jan 2021 – Oct 2026
Results in R: 1R is the amount you risk per trade. If you risk $50 per trade, +10R means +$500. 49 of 70 months were positive, 21 were negative.
| Year | Result | Note |
|---|---|---|
| 2021 | +29.5 R | unseen data, never used in development |
| 2022 | +22.8 R | bear market, unseen data |
| 2023 | +45.5 R | unseen data |
| 2024 | +84.7 R | development year |
| 2025 | +93.3 R | test year |
| 2026 | +87.4 R | through October |
Method: simulation on Binance 1-minute data with 0.03% fees per side. The rules were developed on 2024 data and then tested on 2021–2023 and 2025–2026. Slippage, missed signals and execution errors are not included. Live results will be worse; realistically, plan with a fraction of this.
Backtest examples
Three trades from 2026. Two winners and one loser, because we don't hide the losses. Simulated on historical data, not live trades.
SIMULATION · THIS ACCOUNT DOES NOT EXIST
What if someone had taken every signal since January 2026, risking 1% per trade with compounding? Result at the end of October: $11,672.
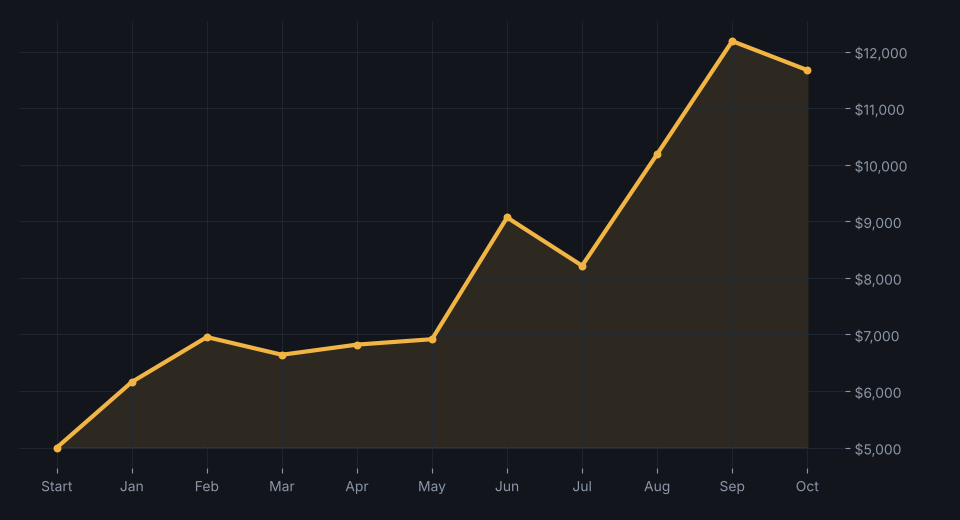 Look at July: −9.4% in one month. Phases like that are part of it. This is a backtest calculation, not a real account and not a promise.
| Month | Change | Balance (simulated) |
|---|---|---|
| Jan 2026 | +23.2 % | $6,160 |
| Feb 2026 | +12.9 % | $6,955 |
| Mar 2026 | -4.5 % | $6,642 |
| Apr 2026 | +2.7 % | $6,821 |
| May 2026 | +1.4 % | $6,917 |
| Jun 2026 | +31.1 % | $9,068 |
| Jul 2026 | -9.4 % | $8,215 |
| Aug 2026 | +24.0 % | $10,187 |
| Sep 2026 | +19.6 % | $12,183 |
| Oct 2026 | -4.2 % | $11,672 |
Live track record
Every signal is posted with a timestamp when it triggers and listed here, winners and losers. Nothing gets deleted afterwards.
| Date | Coin | Setup | Direction | Entry | Stop | Result |
|---|---|---|---|---|---|---|
| [LIVE TRADES: added continuously from November] | ||||||
Live results on Instagram: @zerotilt.trading
Roadmap
Today the indicator tells you what to do. The goal: it does it for you, with zero emotions in the loop. New features only ship after they pass backtesting and live testing. Dates are goals, not promises.
NOW · NOV 2026
Founding beta
Indicator, setup guide, phone alerts. Public live track record starts.
JAN 2027
Version 1.0
First two months of live results published. Regular pricing and lifetime plan.
PLANNED · 2027
Signal bot
Alerts directly via Telegram or Discord, with position size calculated for your account.
THE GOAL
Fully automated
Zero Tilt places and manages every trade for you on your own exchange account via API. Your funds never leave your account, and you can switch it off any time. Released only after legal review and extensive live testing.
ONGOING
Continuous development
New setups or coins only if they hold up on unseen data. Every change is documented.
Pricing
FOUNDING BETA · 30 SPOTS
$19.99 / month
Your price stays locked as long as you stay subscribed. Cancel any time.
REGULAR · FROM JAN 2027
$39.99 / month
Same features as the beta, once two months of live data are published.
From January 2027
LIFETIME
$349.99 one-time
Pay once, keep access to the indicator, guide and updates.
Payment and access via Whop. You are buying a tool and a guide, not asset management and not a profit guarantee. By purchasing you accept our Terms of Service.
The figures from 2021 to October 2026 are a backtest, a simulation on historical price data. Real live results start on November 1, 2026 in the live track record.
In the backtest, about 18 per month on average across all three coins, spread very unevenly. Some weeks are quiet.
You need one alert per chart (BTC, ETH, XRP), so 3 alerts. Check the current alert limits of your TradingView plan before you buy.
No. You get an alert and place the trade yourself. You never share access to your exchange account.
Check your prop firm rules first. Many prohibit third-party signals or strategies. That responsibility is yours.
Any time, directly in your Whop account. Indicator access ends with the subscription.